Decision-making is one of the most important fuels that drives a successful enterprise. An enterprise can have the best employee talent, superior processes and systems, and fantastic resources, and find it competes terribly if it can’t make good decisions.
Let’s talk about decisions. Decisions attempt to prioritize competing choices and select the ones with the best overall outcomes. Decisions can be simple, or they can be quite complex.
Decisions can provide answers to questions such as:
- “What do our customers really want?” After all, our customers have many choices. They each seek to maximize their individual utilities, or the value they get from the money they spend.
- “How are our customers different from one another?” What’s important to one customer may not be the same as what is important to another.
- And, maybe most importantly, “What should we do?”
Choice modelling (or factor modelling) is a superior method of prioritizing competing choices. Especially complex ones.
In this post, we will explore a method of choice modelling called “Maximum Difference Scaling” or its popular and well-known contraction, MaxDiff.
Complex decision-making in vehicle purchasing
Let’s go deep on one application: buying a vehicle. As an example, here are just a few (36 in total) of the choices that need to be made, or factors that need to be considered, when someone is purchasing a vehicle (or if you are a business, deciding which vehicles to stock):
- Has four-wheel drive, or off-road capabilities
- Has a great sound system
- Has a sunroof
- Has heated seats
- Gets great gas mileage
- Has navigation
- Is inexpensive to service
- Dealership has a good reputation
- Has cooled seats
- Has third-row seating
- Is a convertible
- Has a backup camera
- Has decent cargo capacity
- Has an electric transmission
- Has towing capabilities
- Dealership specializes in this type of vehicleHas great tires
- Has leather seats
- Makes a statement about my personality
- Has nice wheels
- Is the right color
- Is pet friendly
- Dealership is close to my home or work
- Has a cruise control with safe-distance spacing
- Has computer-assisted parking
- Has high-performance handling
- Is highly fuel efficient (if not electric)
- Dealership will deliver it to my houseHas excellent safety features/high safety rating
- Domestic or import manufacture.
- Dealership also services vehicles
- Is self-driving (autonomous)
- Dealership will service the vehicle at my home or office
- Luxury or standard model
- Integrates with my portable devices such as a phone with Bluetooth
- Price
I’m sure you can think of even more factors. While I encourage you to do so, the point is that the decision to purchase a vehicle—and for a business, what vehicles to stock—is complex.
Our company is headquartered in the heart of Western New York (WNY) in Lancaster, a suburb of Buffalo. The climate varies greatly from season to season, and within the WNY area there are many different sub climates at any time in the season.
To the north and west, we have a more temperate climate which is moderated by Lake Erie and Lake Ontario. This area is remarkably flat because of the southernmost glacial push from the last ice age. Here, there is a great deal of agriculture, from apples to grapes to corn and dairy farming, the land is fertile and often quite rural. In both areas, we also have several beaches along those lakes, forming minor seasonal beach towns.
To the south, we again have a rural community, but this time nestled 1200–1800 feet higher above sea level in the foothills of the Appalachian Mountains. This area is also highly agricultural. It is known for dairy, beef, and berry picking. It is marked with hills and valleys and is known as the “Snow Belt.” On average, it can expect about twice the annual snowfall that Buffalo receives. The major ski areas for WNY are all located there. As with snowfall, this area also sees higher levels of precipitation all year long.
Finally, in the middle, we have Buffalo and its suburbs. Its topography is quite flat, with suburban to dense urban populations. Much of the business activity in this area is comprised of manufacturing, banking, and retail activities.
Why do I share all this background information?
Imagine I need a vehicle. I have choices to make as a consumer if I want to maximize my utility. If I am in the business of selling or servicing vehicles, I have some choices to make in terms of what I provide to make sure I have the right selection to offer.
As an enterprise, leadership will often have a gut feeling as to what I should provide based on the types of customers I’ve already attracted to my business. Very often, a type of forecasting called “naïve forecasting” is done, which is to say, this year’s sales will mimic last years’ sales. No doubt, that gut feeling will often suffice, and serve you well enough.
But could I sell more if I truly understand what my customers want? And what if I did that well enough that I understand what other dealerships’ customers want?
Using MaxDiff in decision-making
Let’s sort this out. If I ask consumers on a scale of 0–10 how important each of those factors are, I’m likely to obtain a lot of insight. For example, if I ask how important it is that the vehicle is in my price range, I’m likely to hear that it’s very important, or on average close to a score of 10. And if I ask how important it is that the vehicle has a high safety rating—again, I’m likely to hear that it’s very important and the score is close to a 10 on average. In fact, all these factors (when measured on their own) should in theory score highly.
That doesn’t mean much to me when I’m trying to select the best cars for my lot.
A better way to solve this problem would be to use MaxDiff, a technique that allows us to put all of the factors in a blender and score them relative to one another.
That means, of the 36 attributes, each one will have a preference score that, when totaled, will sum to 100%. This allows me to analyze the scores relative to one another. It allows me to prioritize and understand the strength of the priorities relative to each other.
How do I do that?
Instead of presenting the 36 factors one at a time, I present six of them together at random several times. The list of the six factors presented is randomized, but in a way that no survey respondent evaluates the same list twice. From each list, my job as a respondent is to choose the factor that is most important, and the factor that is least important.
For example, as a respondent my first list of factors to evaluate could look like this:
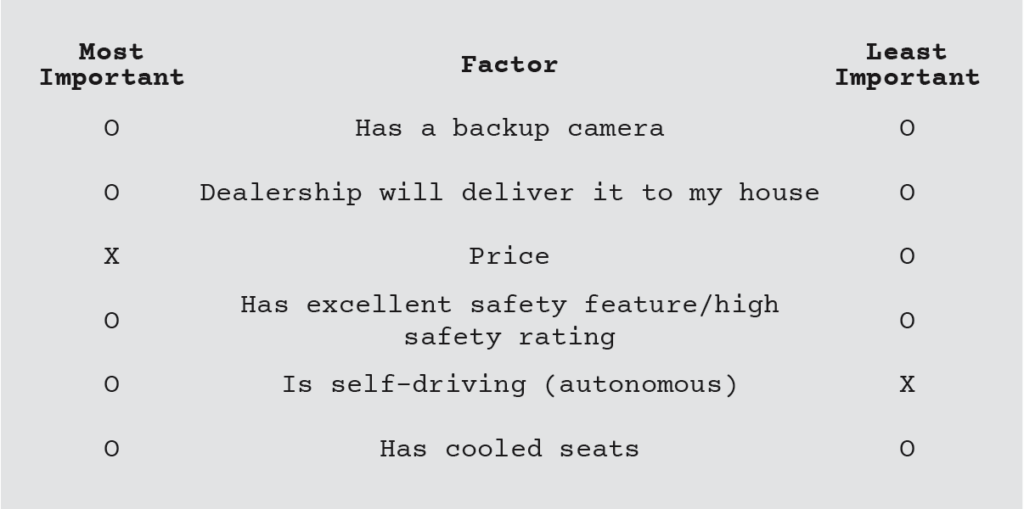
I evaluate each one relative to the others, and I select the one I think is most important to me, and the one I think is least important. It’s not that the other factors aren’t important to me, it’s that, relative to one another, if I’m forced to prioritize the options, I pick the one that will maximize my utility (or what’s important) and do without the one that is least important to me.
The next time a random list is presented, it will be somewhat or even totally different.
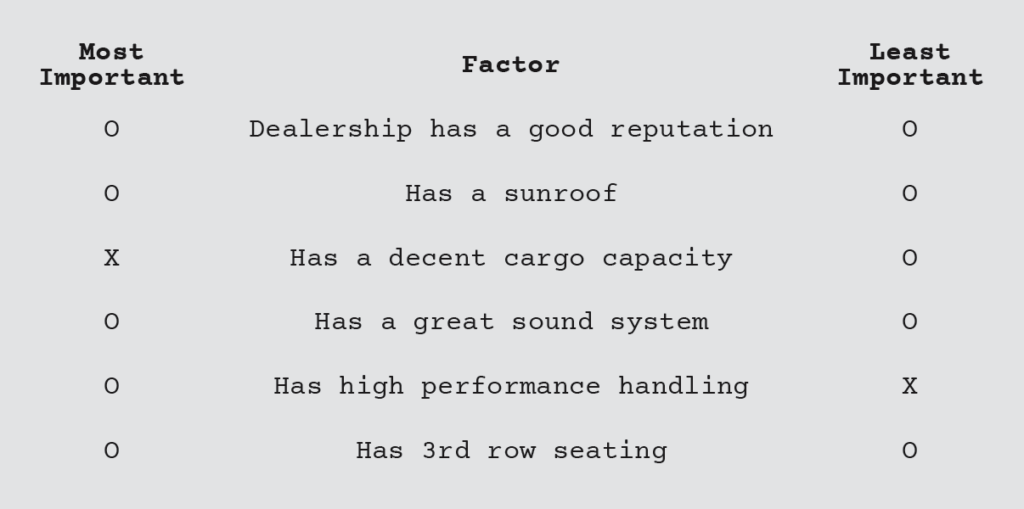
Again, I make my priorities known.
After enough respondents react and prioritize what’s important, some complex statistics take over and analyze the set of all the options and responses.
The output is the list of 36 options with scores relative to one another and totaling 100%.
Here is an example of what the partial overall output might look like:
These are overall scores in this example. (These are not real scores, this is just an example.)
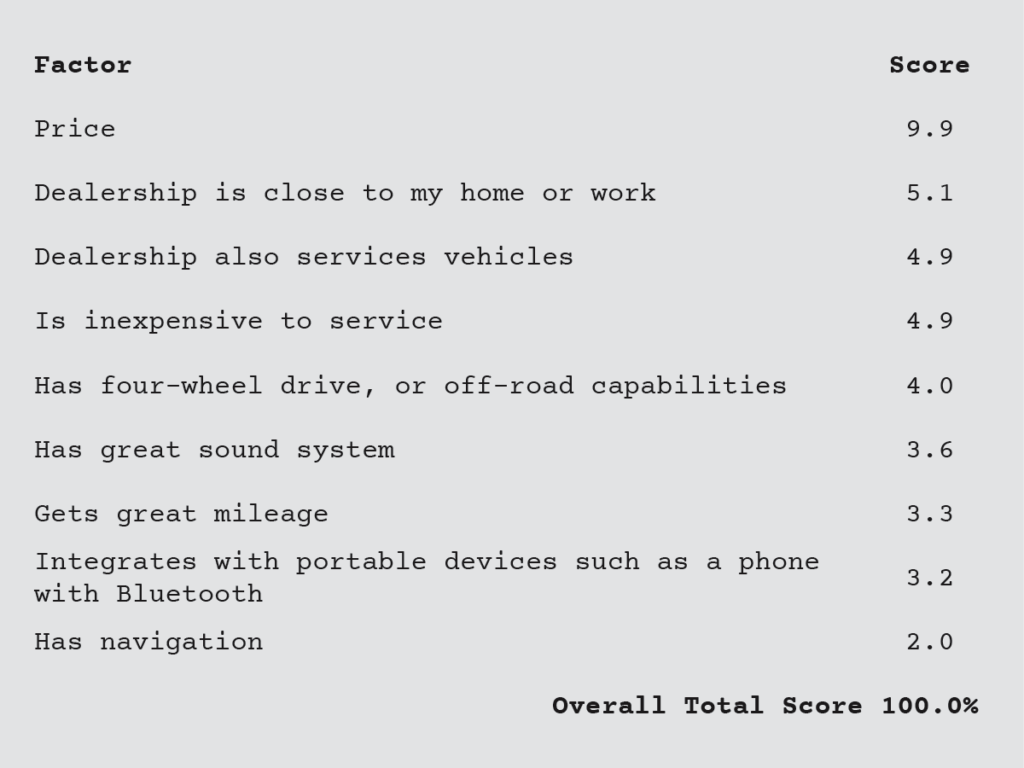
Because the scores are standardized, and relative to one another, we can directly say that “price” is three times more important than “great gas mileage” to this population, and having “navigation” is half as important as “four-wheel drive, or off-road capabilities.”
And I can learn about similarities and differences between different types of consumers—where they live, how old they are, how much money they may have to spend. As an enterprise, I can now prioritize what I offer, with confidence, and look at the sizes of each segment.
In the Southtowns, the priorities could be different based on overall needs. Their factors may look more like this:
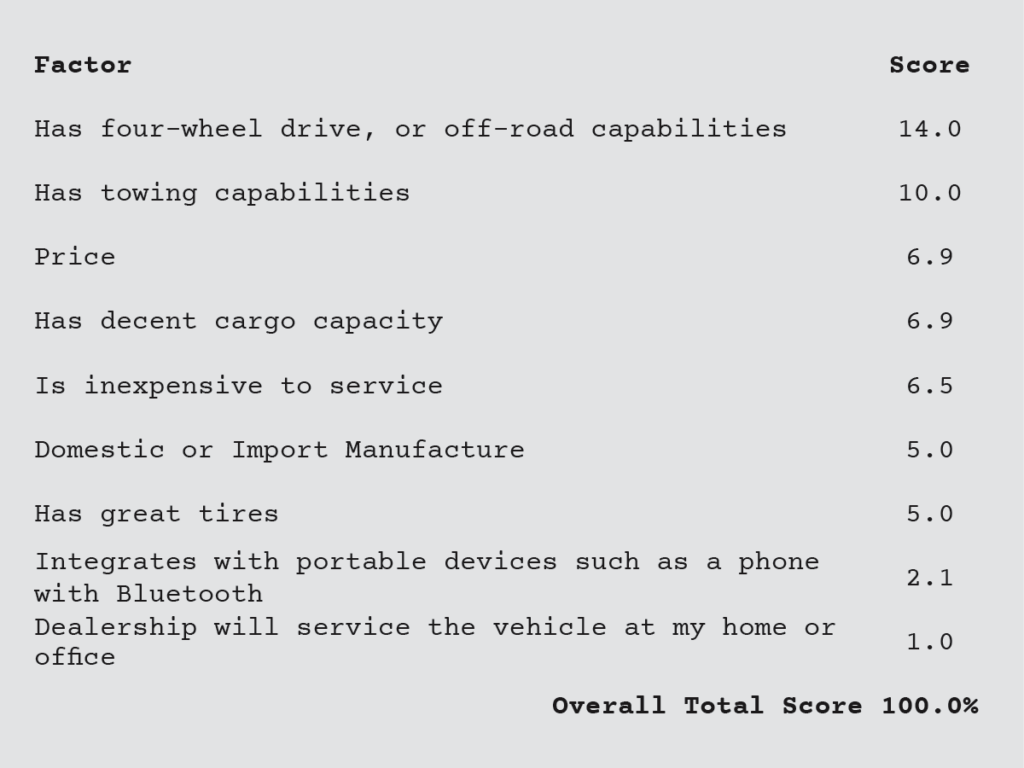
I can now look at different segments of the WNY population, and tell you with confidence what their priorities are, and the strength of each factor relative to one another.
MaxDiff can be applied to a broad range of applications. From determining what factors to prioritize for consumers at a grocery store is one application to what programs a private school might offer its students to what patient services a hospital should offer—it’s a valuable tool that spans industries.
For more information on Market Research, Business Strategy, or how MaxDiff can apply to your business, contact FARM today.