I’m back, fam, bringing you more need-to-know information about Google Analytics’ notorious update to GA4. Previously, I covered the basics of GA4 as well as what you should know about its data retention policy.
This time, I’m diving into the interface a bit more, specifically why all the GA4 metrics look different. If you’ve been looking for bounce rate, this post is for you.
Why the change?
Did Google decide to just overhaul everything to ruin our lives? It’s possible, but we know it came more from a privacy perspective and updating its tracking to reflect how we use the internet today.
Part of that is moving to an engagement-focused platform. This is primarily seen through the focus on events instead of sessions. Instead of looking at all interactions within the scope of a session, GA4 is designed to look at the user journey.
Because of this, the new provided metrics are designed to give you a look at users who meaningfully engage with your website. Which gets us back to an old favorite …
1. Bounce rate in GA4

To the shock and horror of many a marketer, bounce rate didn’t make the cut when it came to new metrics in GA4. Instead, Google provided us with engagement rate, which means that a user either 1) stayed on your site for more than 10 seconds, 2) recorded a conversion event while they visited, or 3) viewed two or more pages/screens.
While this aligns with the new way of focusing on engaged traffic, it doesn’t necessarily soothe the masses who’ve come to rely on their beloved bounce rate to let them know when a user left after only one page view.
So here’s the good news/bad news: You can actually add bounce rate into custom reports (I’ll hit more on that later), but it’s not the bounce rate it used to be. Now, it’s simply the inverse of engagement rate. If your engagement rate is 60 percent, your bounce rate will be 40 percent.
Which makes sense, right? If someone isn’t engaged, they bounce. It’s important to note this isn’t a 1:1 measure, so if you’re comparing your numbers in Universal Analytics to GA4, it will not be the same percentage.
Understandably, this does mean we have to change how we think about our reporting, especially if we plan to only use Google Analytics. Instead of a quick look at our content to see which pages have the highest bounce rate, we have to shift and think about which had the lowest engagements.
2. Two acquisition reports in GA4
Like most report sections, acquisitions saw a major trim in what was automatically available. Now to view source/medium, campaigns, and more, you can add filtering to the current report or customize your own (be patient, I’m getting there).
What remains are two reports: user and traffic acquisition. The latter is your standard channels breakdown (with updated metrics). But what about the former? What makes the user acquisitions report different from traffic?
Featuring less metrics than its counterpart, the user acquisition report in GA4 has a sole focus: new users and their first session. By singling out this audience, you get a quick look at how users are finding your website.
Speaking of users, there’s something else you should know.
3. How GA4 user metrics are defined
Total users means the same thing in both properties, right? RIGHT?
At this point, you should just expect things to be a little bit different in GA4, and the user counts are no exception.
In Universal Analytics, we used total users as our primary metric, measuring all our users. With GA4, it’s still looking at the total, but not of everyone. Instead, it focuses on your unique users who, while visiting, logged an event.
Let’s talk about a metric that didn’t change–new users. Yes, this number still reflects when someone experiences your site for the very first time. You can find it in the user acquisition report and landing page report. Or check out the first_visit event.
The third type of user, and our new primary metric, is active users. When you see a report refer to users, this is what they mean–anyone who registered an engaged session or visited for the first time.
Through the lens of Google’s engagement focus, this makes sense. It’s primarily going to tell you about the users who did something more meaningful on your site or had their first interaction.
Since we’re talking about the engagement focus, let’s talk about some more GA4 metrics.
4. Engagement-based everything
We touched on engagement rate, but that’s only a piece of the engagement puzzle. In fact, you’re going to see that word a lot in GA4. Engaged sessions, engaged sessions per user, average engagement time, and average engagement time per session are here to hammer home the point that engagement matters.
The general sessions metric in Google Analytics still exists, largely the same, only now it won’t restart a session at midnight or if someone enters new campaign parameters. The engaged sessions metric takes it one step further to show you how many of your total sessions featured engagement (the same parameters that go into engagement rate).
Average engagement time looks at when your site is actively being used, not just open in a browser tab somewhere, while average engagement time per session looks at how long a user was engaged during the session.
Okay, enough of saying the word engagement.
5. Events-based reporting in GA4
I’ve touched on this before, so I only want to mention events in terms of how they’re counted. In Google Analytics, you would see them measured as total events. Event count is the new GA4 metric, and they differ only in how events are defined.
Before, your total events would look at what you set up as events through your site or Google Tag Manager. With the move to events-based reporting, GA4 logs every “hit” as an event, so beyond what you create, this also factors in things like first visits and page views.
Because events per session and event count per user are new metrics, it’s good to remember they aren’t just what you created, but any action taken on your site.
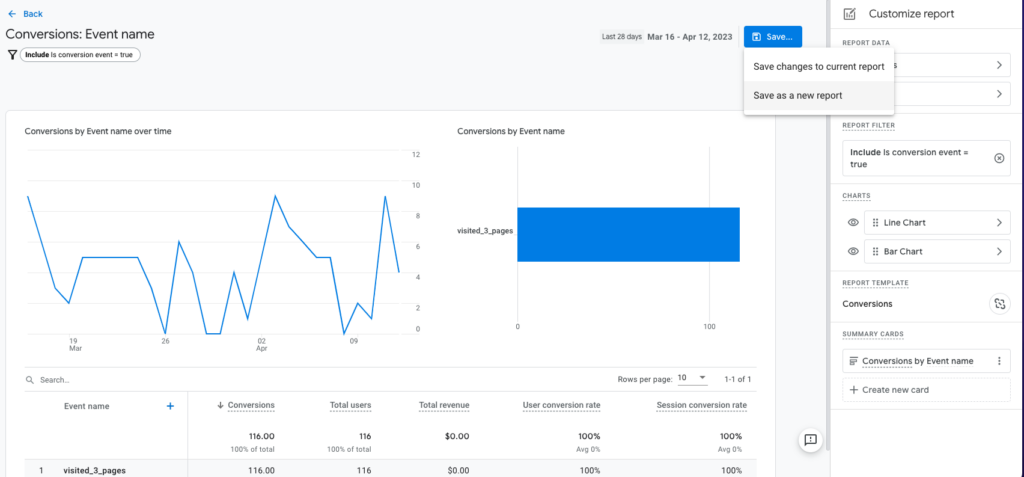
Conversions are now solely linked to events, giving us the option to mark any event we choose as a conversion. You may have noticed that conversion rate isn’t automatically included in the conversions report.
Like bounce rate, it can be added (we’re almost there!), but now you have two options: session conversion rate and user conversion rate. The choice (if you make one) comes down to how you want to view the data, through sessions or users.
At this point, you should know and understand a little bit more about how things are measured in GA4, but what if you want to change it up? You’re in luck.
BONUS: Customized reports in GA4
Yes, we finally made it. I told you we would. One of my favorite parts of GA4 is the ability to customize your reports. You may be thinking, “of course we can customize reports–we could do that in Universal Analytics.”
Listen, I know. It’s just better now.
Like its predecessor, you can either edit a report directly in GA4 or create one from scratch. The new Library area is where you can access all your reports or develop a new one based on your specific needs.
From there, you can even build Collections, which are the report groupings you see on the left of the screen. This functionality allows you to custom create your own sets of reports, say for specific campaigns or clients, and publish them as collections that appear in the main navigation.
I like this for a few reasons. While you can customize the primary reports, I like to keep this to a minimum, so they remain the general picture. Depending on your business, this might not be the same for you, and that’s okay. Publishing a collection allows me to drill down into the specific channels, sources, and campaigns that matter most and have them easy to access while still having the main data right there.
In Universal Analytics, for many marketers, custom reports weren’t as important. Google provided a lot of drill-down options already, so you didn’t need to go further than a secondary dimension (unless you wanted to be really fancy).
Without these readily available, we as marketers can define what is important to us and not get bogged down with everything else. Plus, if you just want to take quick looks at your data, you can add up to five filters directly in the reports without altering anything.
So, for all my friends out there frantically looking for bounce rate or even conversion rate in GA4, worry no more. Go ahead and make the report your own.
Navigating new metrics
Change like this is difficult. Not only is it a new system, but a new way of thinking for a lot of us. I believe that someday, in the same way we all rolled with the new Facebook layouts (am I dating myself?), we will think in engagements just like Google.
But until that time, if you’d like some additional help, let me know. Sometimes we could all use a friend when navigating the unknown.